|
|
|
|
|
|
|
|
|
Shipping and Intermodal
Transport Systems
Another option to overcom Yangon River's depth constrain was based on constructing a ship-to-barge transfer terminal outside the sandbarge at the River mouth. The planned transfer would be between 5,000-TEU ships, expected to dominate the future Intra-Asian trade, and 200 - 300-TEU coastal barges. The barges will serve both the existing terminals and new terminals at the Industrial Zones on the upper reaches of the River. The two conceptual layouts above include a conventional terminal, based on Reachstackers and Slewing cranes and an automated one, based on "barge-in-a-slip" and wide-span RMGs. 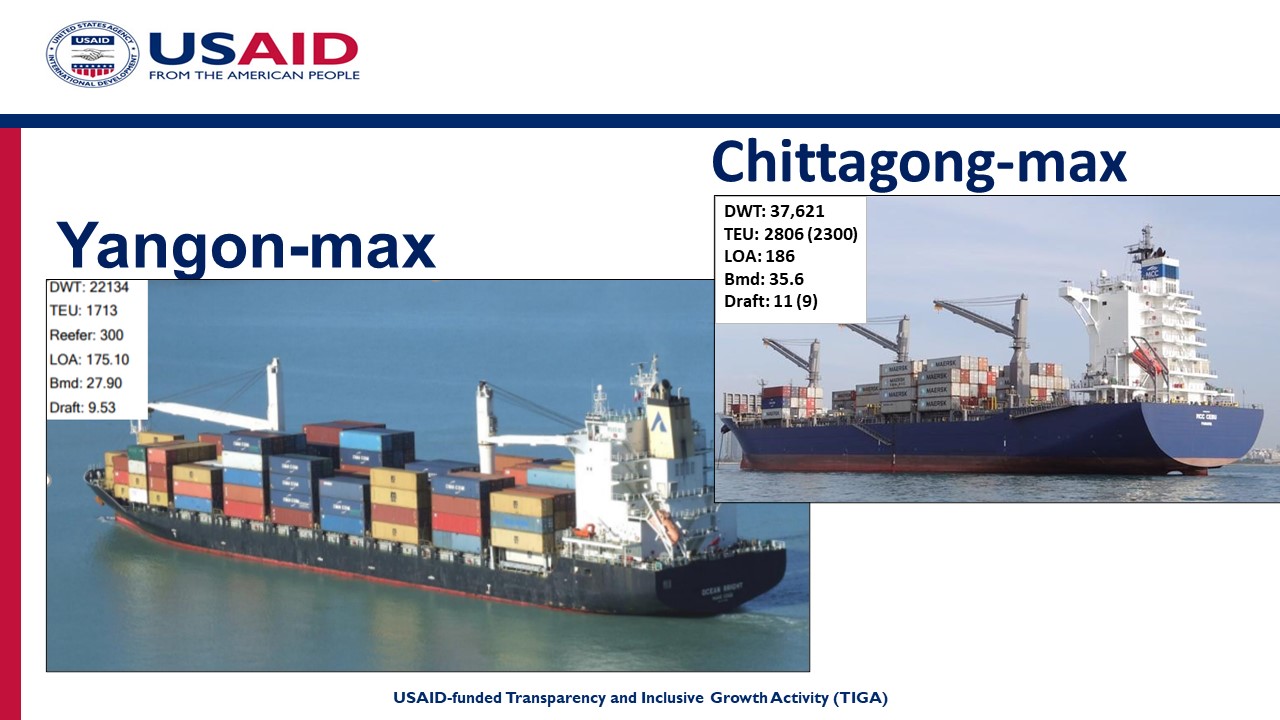
Many Asian ports are river ports with relatively-shallow draft channel, limiting the size of ships calling there. An elaborated fleet forecast was a central component of our masterplan study of Yangon port. One option was to dredge the sandbar at the entrance to the Yangon River to allow major Intra-Asian services sailing between Central China and Bangladesh to direct-call at Yangon whil operating Chittagong-max ships, which are about 50% larger than the Yangon-max. .jpg)
Deepening the channel of the Port of Jacksonville, FL from 40-ft to 47-ft is intended to allow the handling of PPX2 vessels deployed on Asia-USEC/Panama route. The assessment of the economic feasibility of this $704.5 million project from a national point of view is based on its Benefit/Cost ratio (BCR), with benefits generated by vessels' scale economies. This require, the development of an elaborated fleet forecast and detailed comparisons of vessel costs in two scenarios: with and without the channel project. 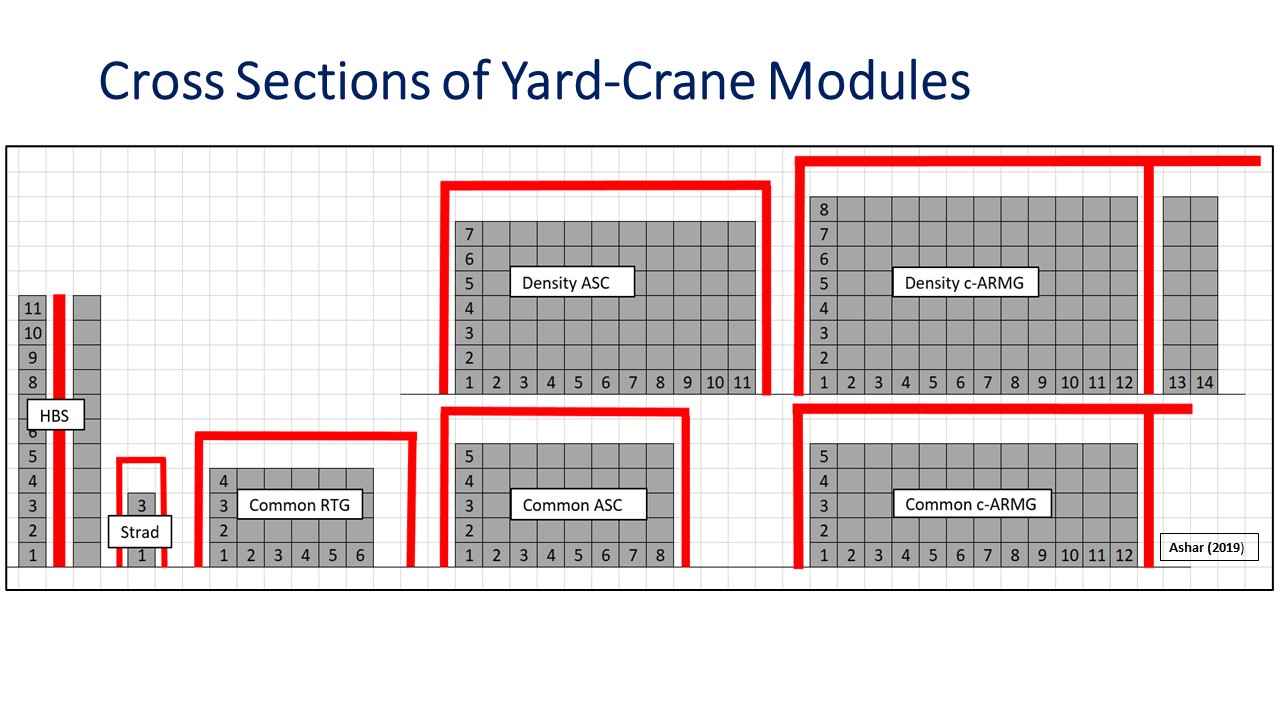
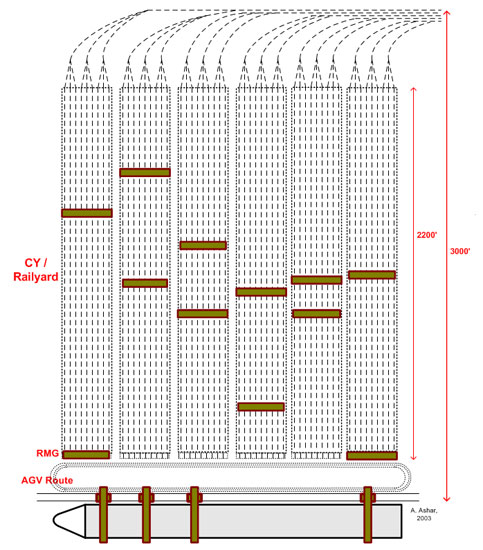
A shortage in waterfront area forces marine terminals to densify their CYs using yard cranes. Modules (configurtions) of the most popular existing -- and future -- cranes are presented above and analyzed in a PTI paper included in the Publications Section. 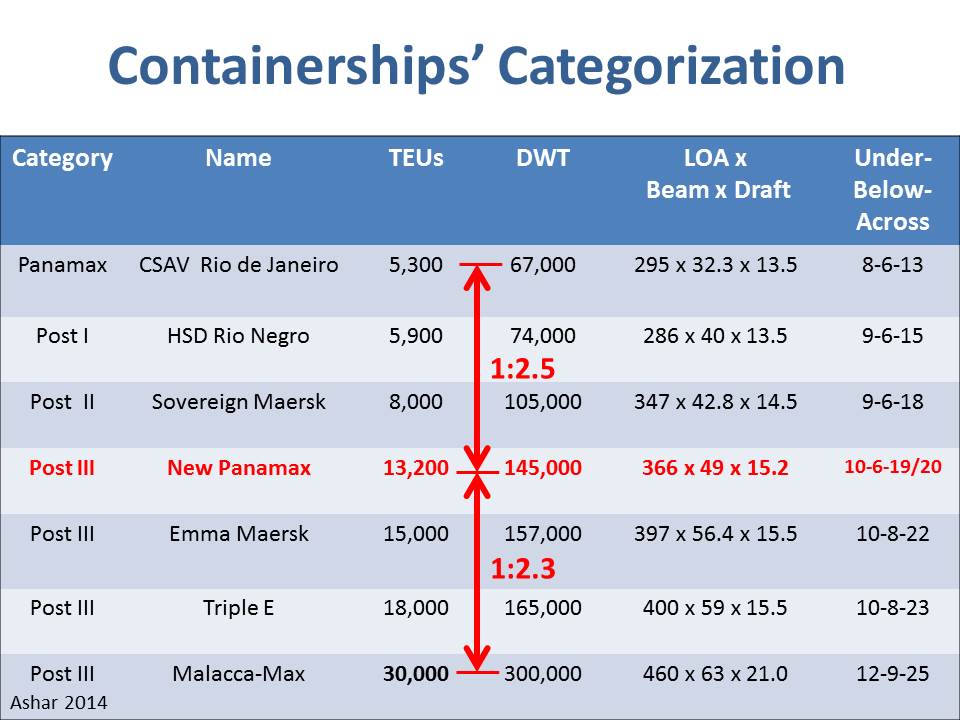
This is the content for Layout P Tag The Panama Canal has traditionally served as a common measure for categorizing ships into those smaller and larger than the Panamax. Among the ships larger than Panamax, or post-Panamax, the categorization is less definable. The largest containership presently (2020) in operations has nominal capacity of 24,000 TEUs; it is too big to transit through the expanded Panama Canal. The largest containership envisioned in the future is the Malacca-Max with estimated capacity of 30,000 TEUs. Interestingly, the capacity ratio between the Malacca-Max and New Panamax is similar to that between the New Panamax and Panamax, ranging 2.3 - 2.5.
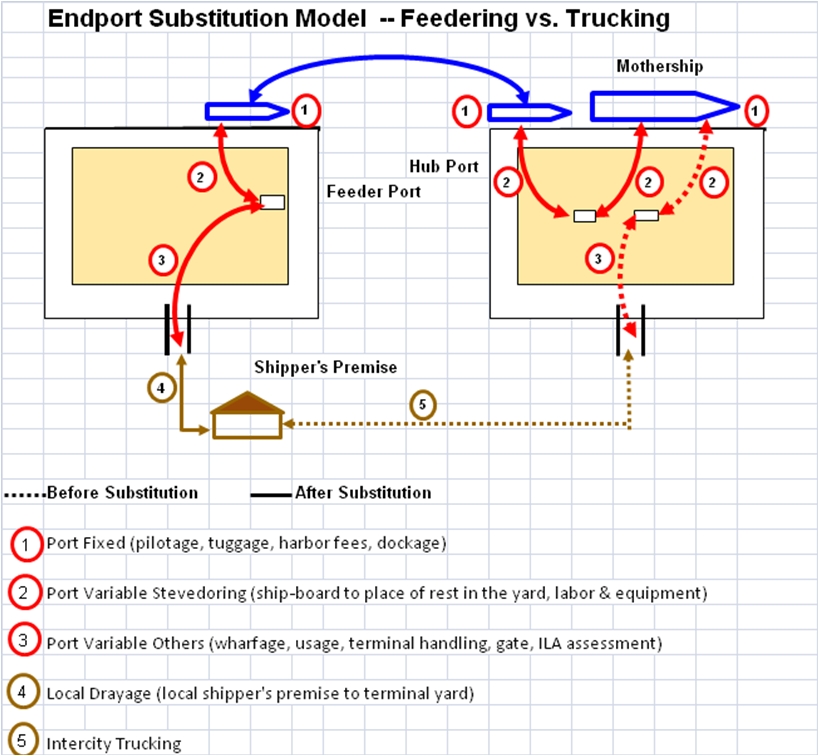
The US has been considering Short Sea Shipping (SSS) for distributing ISO containers (and domestic containers) for a long time. The chart above, taken from a study of potential US East Coast feedering system, illustrates the various activities and respective costs involved in SSS and competing truck-based distribution processes.
The volume of ship-to-ship transfer of containers (transshipment), is expected to grow in line with the continuing growth in ship size. The chart illustrates the four principal transshipment patterns. Three patterns, By-Passing, Tail Cutting and Hub & Spoke, involve Mother-to-Feeder transfer; the fourth, Intersection, Mother-to-Mother transfer. Two patterns, By-Passing and Tail Cutting, involve eliminating ports; two, Intersection and Hub & Spoke, adding (Hub) ports. All transshipment patterns generate additional port traffic. In Hub & Spoke, the traffic at the new Hub port is twice that of all ports combined (see formula)! This port is a Pure Transshipment Port (PTP), since it only handles transshipment traffic.
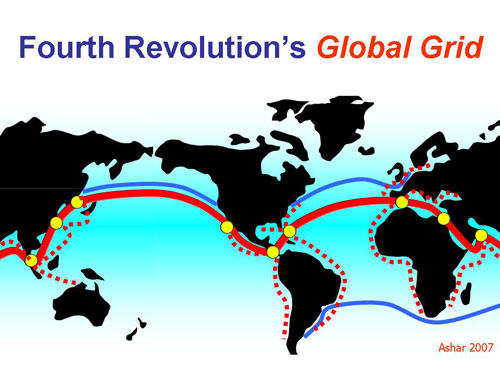
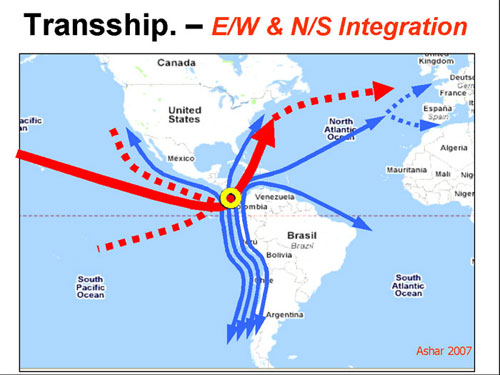
The Fourth Revolution theory addresses the long-term developments of the global service pattern. The theory predicts the emerging of a new, bi-directional Equatorial-Round-The-World (ERTW) services intersecting with North/South services, creating a "global grid". The ERTW will employ the largest ships that can transit Panama Canal, the New-Panamax (NPX). The largest future ports will be Pure Transshipment Ports (PTP) located at the ERTW intersection points with the North/South services (marked in yellow in the chart above). The global grid will foster a transportation system based on multiple transshipments, facilitated by innovative shipping and handling port technologies based on multi-container units (see below).
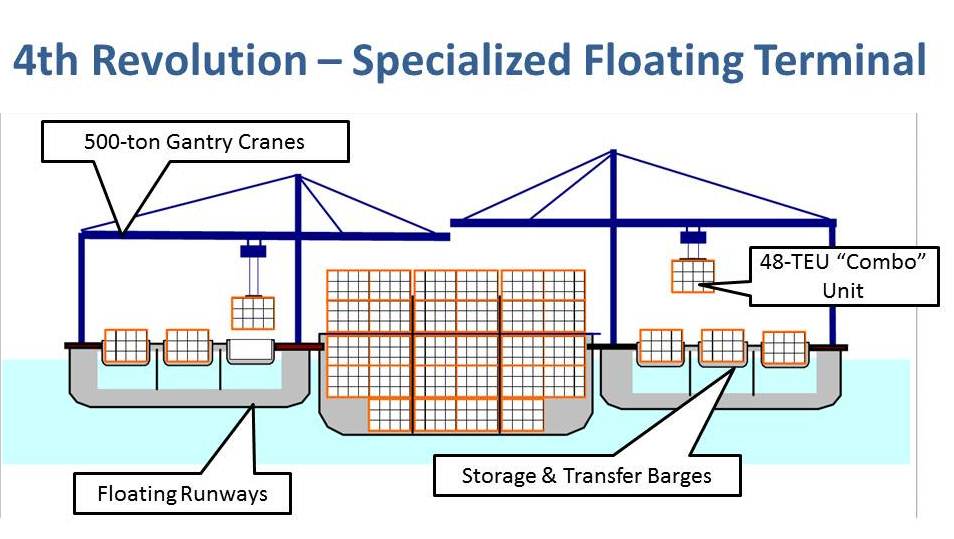
The 4th Revolution will foster the emergence of Pure Transshipment Ports (PTP) at the intersection points between east/west and north/south trade routes. Since, the PTP operations will involve a large number of boxes groups of containers transferred between ships. A futuristic transfer system will be based on handling "combo" or multiple-box units, using special harbor barges as temporary storage and transfer vehicles for these combos, eliminating the double handling (ship-to-yard, yard-to-ship) involved in the current land-based terminal system. The floating configuration also allows the handling of several ships simultaneously. With 10 lifts/hour and 2 cranes/ship, handling productivity can reach 1,000 TEUs/hour. The floating terminal configuration has some similarity with the LASH, based on 510-ton barges lifted on-board ships, except that it avoids the "steel-on-steel", since the barges themselves are not loaded aboard ships.
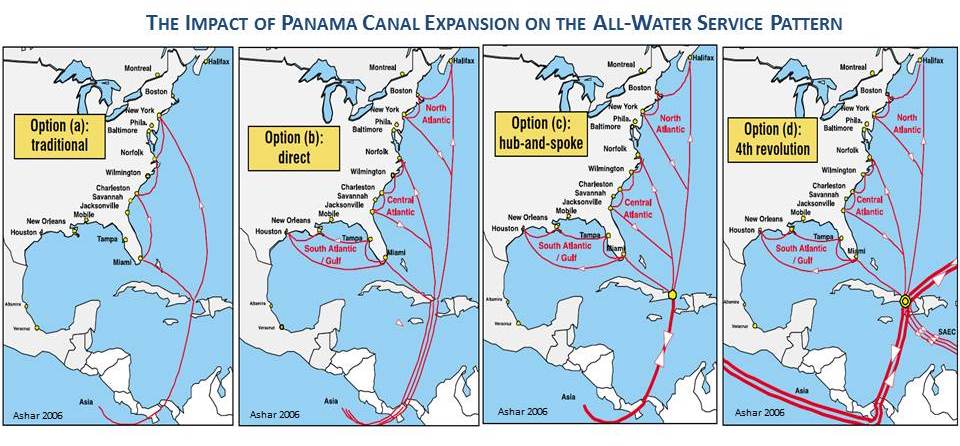
Our 2006 analysis of the impact of Panama Canal expansion on the service pattern of the Asia / USEC, identified three generic options, as presented above, Option (a) is the existing one; Options (b) assume coastal specialization; Option (c) assume a hub-and-spoke, based on off-shore hub; and Option (d) is one based on the Fourth Revolution ERTW discussed above. It should be noted that only in Option (b) large Post-Panamax ships are expected to directly call USEC ports, while in Option (c) & (d), smaller Post-Panamax and Panamax could be the dominant ships calling there. Additional calculations, not included here, provided the implication of each alternative on shipping cost.
Following the expansion of the Panama Canal and the development of Panama's hub ports, the entire regional shipping system could be transformed. The emerging system could be based on intersection of East/West and North/South services in a "radiating" fashion, similar to that common in air services. The North/South service along the Pacific Coasts of the Americas could handle both the North/East trade and feedering the Asian and Atlantic trades.
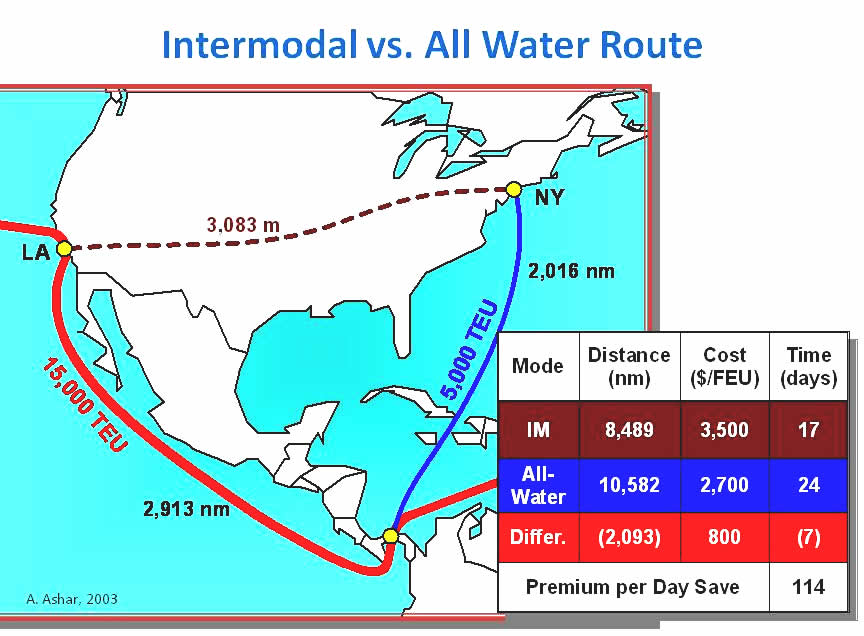
Estimating the diversion level of the Asia / USEC traffic from the water / rail or Intermodal (IM) to All Water through-Panama route was the most challenging task in the feasibility study for the Canal expansion project. Our methodology was based on an innovative route allocation model based on the Premium-per-Day-Saved as its main explanatory variable. The specification of the Logit function employed in this model was based on historical data on market share of each route, along with interviews with shippers, focusing on identification inflection points..
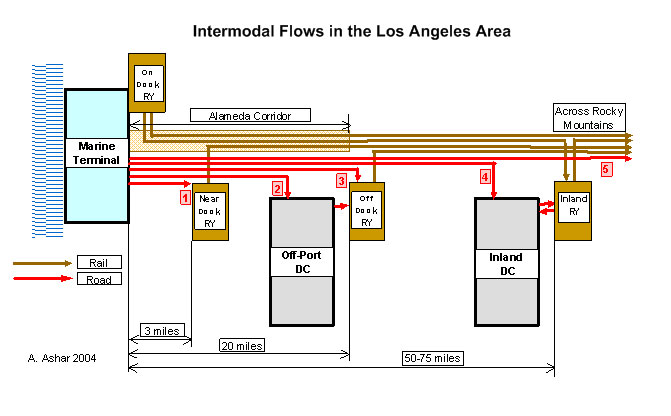
Defining and understanding the various options for the ship-to-rail intermodal transfer is essential for planning of US ports, most of which are heavily involved in handling container destined to remote hinterland. This chart, we developed for the Port of Seattle, WA, differentiates amongst the various options according to the distance from the dock (marine terminal gate) and traffic mix handled,
Assessing the viability of the Tehuntepec Land Bridge in Mexico's isthmus had much similarity to that of the Panama Canal (above), except that in this case there are more contenders, among them other Mexican ports as well as intermodal routes through US Pacific Coast and the All-Water route.
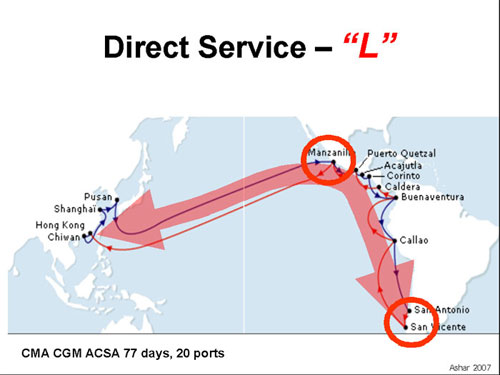
The "L" shaped service pattern is currently the dominant service pattern of the West Coast South America / Asia trade lane, coupling the trades between Asia and the West Coasts of Central and South America and the Intra-America trade. Following new port projects on the Americas side, this pattern may be "de-coupled" into direct Transpacific services and a North/South services (see below). Assessing trends in service patterns was critical in the planning studies we conducted for Mexican Pacific Coast ports; Puerto Quetzal, Guatemala; Puerto Callao, Peru; Santos, Brazil; Tema, Ghana and others.
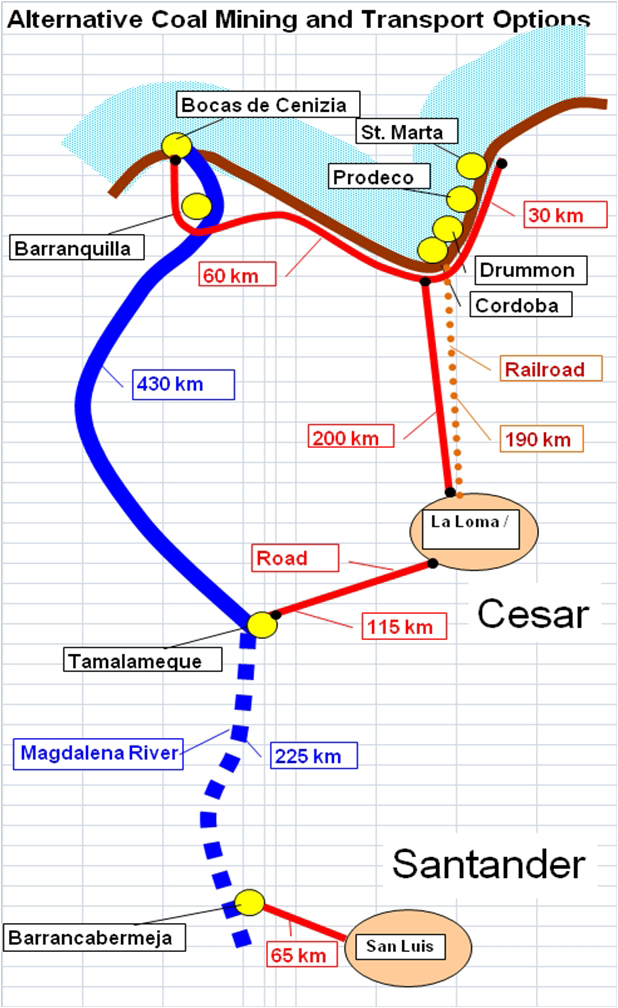
Bocas de Cenezia is a new coal export terminal on the mouth of Magdalena River in Colombia. The main advantage of this terminal is the barge connection to far away mines. The feasibility study of this terminal involved defining alternative routings between hinterland mines and marine terminals, identifying the overall mine-to-ship costs and, using a route allocation model, developing demand scenarios.
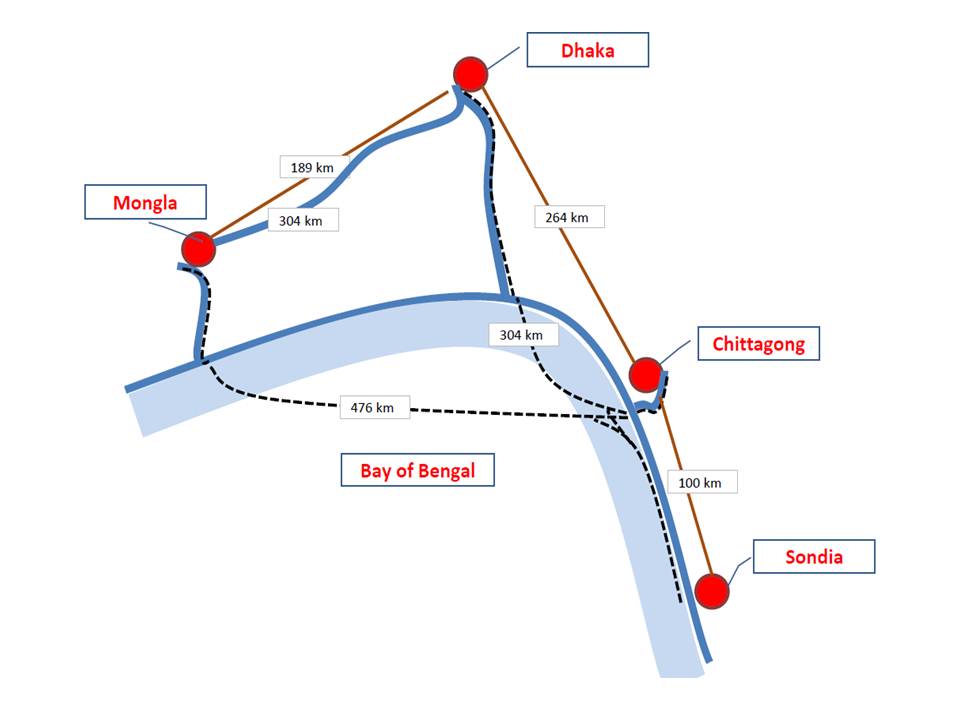
The Port of Mongla, Bangladesh is a river port, located 133 km upland from the Bay of Benga. Until its lost its container services, the port handled local cargoes, mainly shrimps exports. Bangladesh is mainly served by feeder services to Singapore for the Asian trade and Sri Lanka, for the European one. The planned construction of a bridge over the Padama (Ganges) River, could provide Mongla with convenient access to Dhaka, the source and destination point of most Bangladesh containerized cargo. Mongla could also attract transit cargo from northeast India and the Himalayn States. Our 2010 study assessed Mongla's marketing potential, defined development scenarios along with the required channel depth and port facilities, estimated costs involved in each and assessed the overall prospects of this port. Port Operations, Productivity and Capacity
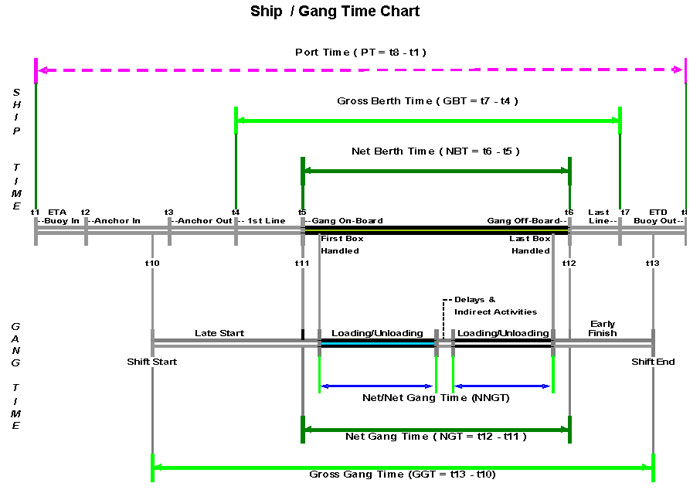
Ship / Gang Time Chart illustrates the ship handling process at a container terminal. It is is a usefully tool for defining and measuring the various ship's and gang's (crane's) activities and respective times. It is also the basis for devising meaningful performance indicators. We developed this chart as part of a system of performance indicators for the Ports of Seattle, WA, USA and later on Cartagena, Colombia; and Tema, Ghana. It was also employed in creating a national regulatory system to monitor the performance of all the Colombian ports and in the Louisiana Statewide Intermodal Plan, USA.
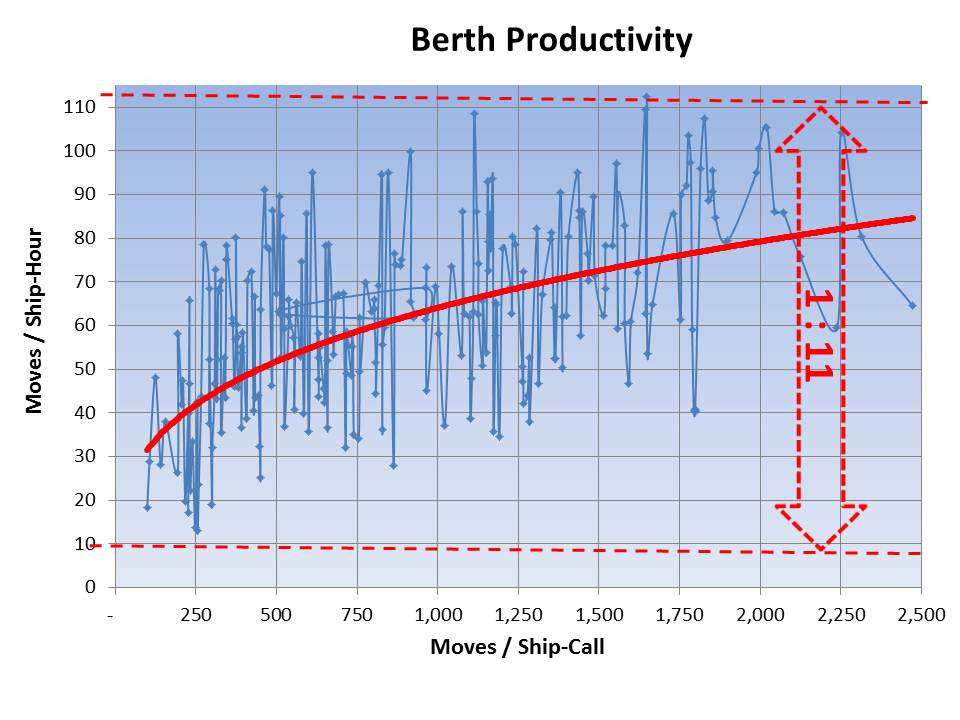
The distribution of Berth Productivity as a function of the number of moves per call and ship size was the key input for the queuing simulation model we developed for assessing the capacity of the container terminal in San Antonio, Chile. The simulation applied a mathematical productivity function (the red line in the chart), based on actual data (the thin blue line), to captures the variations in the productivity. As also seen in this chart, there was a wide range, 1:11, of productivities, which justified the use of a simulation model. The simulation model also allowed assessing the impact on terminal capacity of various future trends, such as changes in ship's arrival pattern, ship's size, ship-handling productivity due to introduction new cranes, and others.
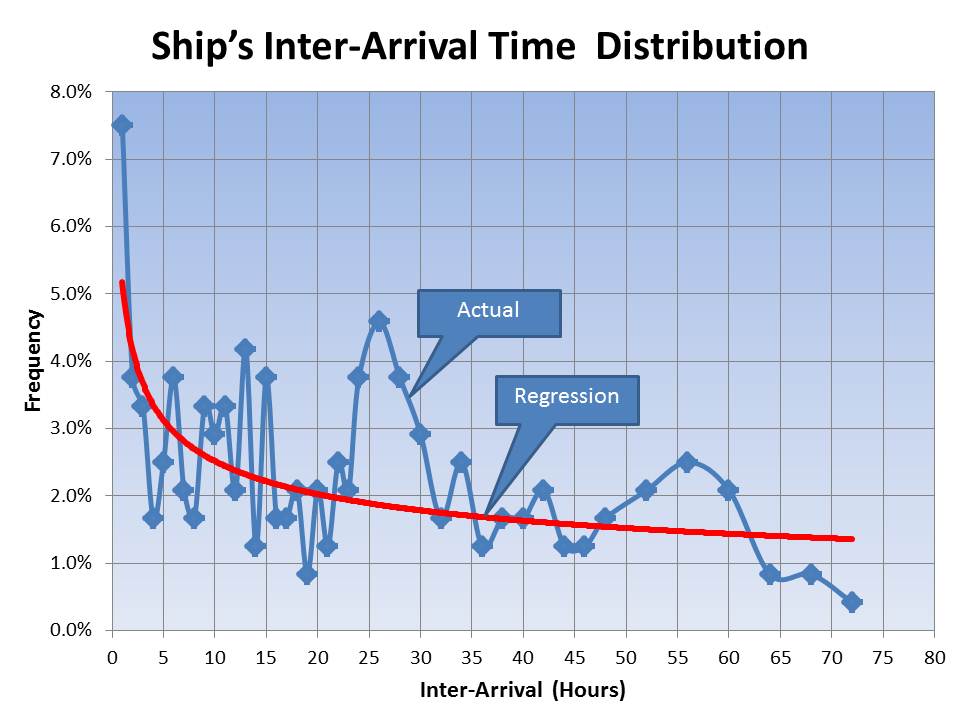
The distribution of inter-arrival time was a critical input for the capacity simulation models of Chilean ports. Instead of using theoretical distribution such as Earlang, the simulation model allowed employing either the actual distribution or an approximation based on regression.
Container terminals usually consist of 3 major components: berth, yard and gate. The most restrictive component, the "bottle-neck", usually determines the entire terminal's capacity. Hence, increasing terminal capacity requires identifying the most restricting component and relieving it. This chart, taken from an analysis we conducted for the National Science Foundations, lists optional measures to do so. In the US, the most restrictive is usually the yard. A simple, non-structural measure to increase yard capacity is through appropriate pricing system as emphasized in this chart.
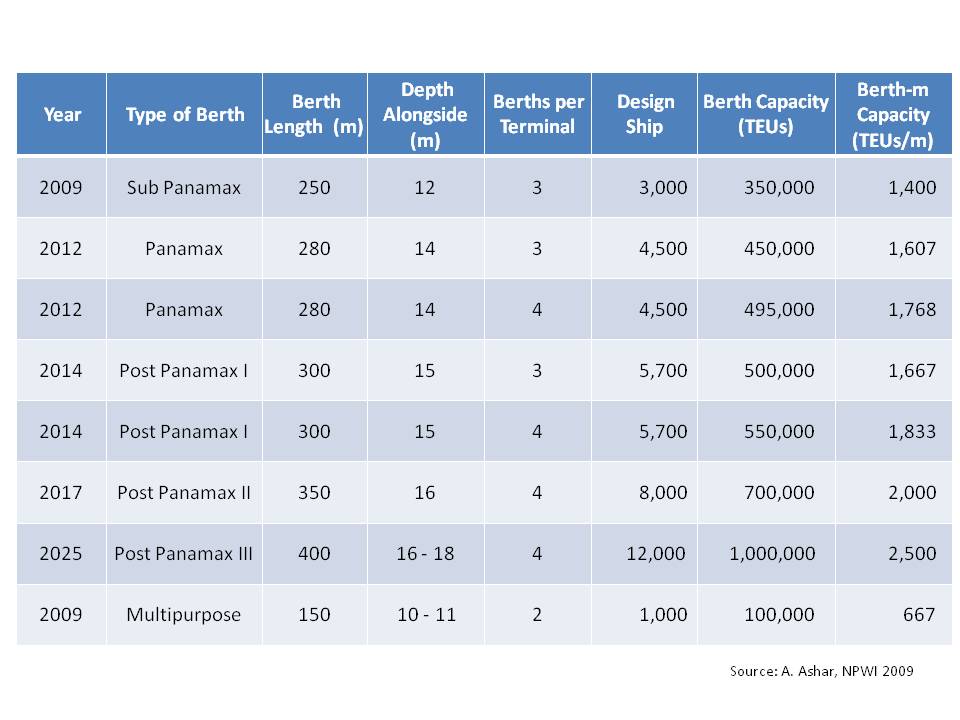
Terminal capacity is determined by the "weakest" (constrained) terminal component, usually the Container Yard (CY). The Berth is usually the most expensive component and, in case of shortage in developable waterfront, the most constrained one. This, indeed, was the case in the Port of Santos, Brazil. Hence, for initial estimation of capacity, we developed a methodology based on Berth Indicators, presented above, with adjustments for insufficient CY/Berth (sq m / linear m). Berth Capacity Indicators also was used in following projects in Callao, Port of Spain, Cape Haitian and Kingston. Based on the above table, a modern terminal geared toward handling Post III with 2,000 m of berthage has the capacity of 2,000 m x 2,500 TEUs/m = 5 million TEUs annually.
The development plan for Central Chile ports (San Antonio and Valparaiso) involves two demand (forecast) scenarios and two supply (capacity) scenario. The demand scenarios involves different growth rates; the supply scenarios are based on different facilities development plans, one supported by the regional port authorities and the other developed by us. A schematic layout of the alternative plan, based on San Antonio Outer Harbor, is presented below in the section on Port Plannint and Terminal Design. Port Planning and Terminal Design
The proposed container terminal (lower portion) is intended to augment the existing one, providing a deeper and longer berthage and much larger yard. The new terminal may delay for several years the need to developed a new harbor outside the present one, saving Georgia several hundred million dollars.
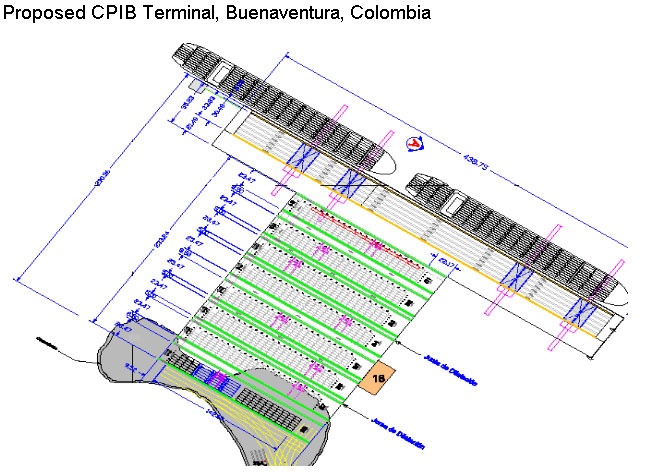
CPIB is a new container terminal in Buenaventura, currently under construction, characterized by a pile-mounted container yard. The high cost of the yard resulted in a relatively small footprint and a dense storage. Assessing terminal capacity was a critical part of the due diligence study conducted for a bank consortium.
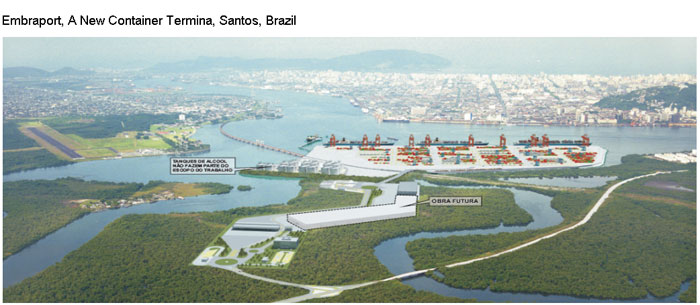
Embraport is a green-field container terminal in Santos, based on a concept we developed during our study of a much smaller bulk terminal at the same location. The proposed terminal, with 1,100-m berth, 50 ha and 10 STSs, is expected to have capacity of 2.1 million TEUs. The terminal was inaugurated in 2013 and currently operated by Dubai Port World. Its 2016 throughput was 664,000 TEUs.
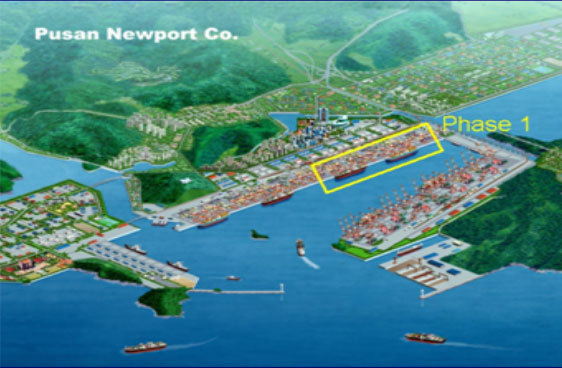
An overall assessment of South Korean ports' development plans was part of our study of a new terminal in Inchon. The main development was the New Busan Terminal, South Korea, considered as alternative to further expansion of Busan. The plan included the creation of a new harbor based on massive reclamation and dredging. Some of this expansion would not be necessary following the development of a new, outer-harbor terminal in Inchon, which is the natural gateway for Seoul the main origin/destination point of South Korea's traffic.
All-Rail automated terminal is a critical component of an "express" intermodal route for Asian import to the US. This envisioned route is based on a combination of dedicated pure-rail shipping services and Pacific Northwest pure-rail ports, such as Prince Rupert, Canada..
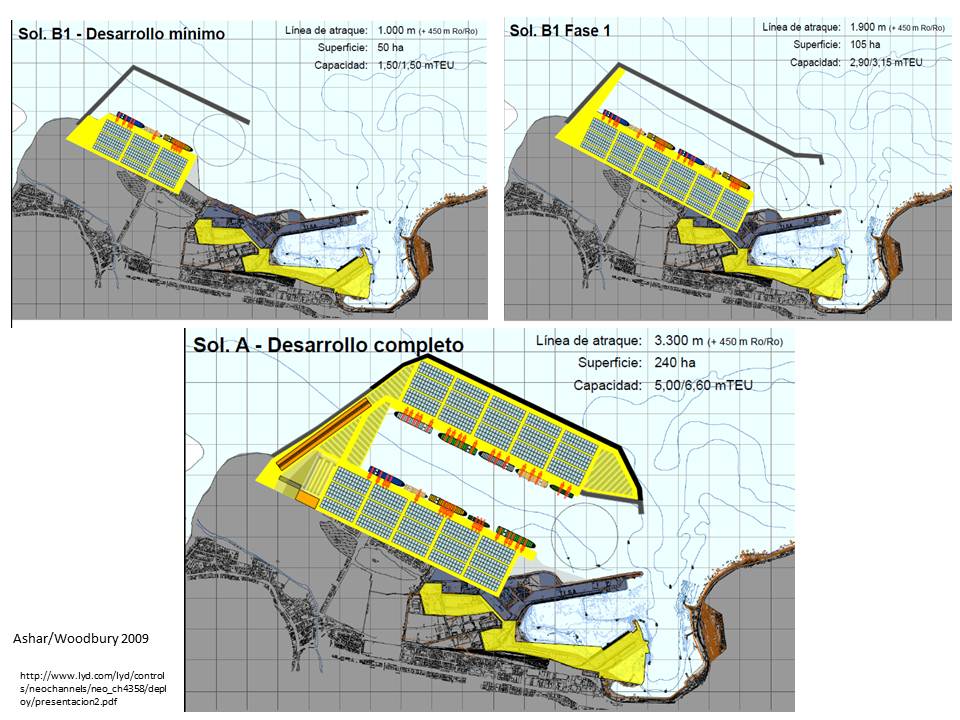
Our masterplan for Central Chile port included two alternative layouts were defined for the proposed San Antonio Outer Harbor, a Minimum Layout, geared to Post Panamax II ships of 8,000 TEUs and 14.5 m draft and a Maximum Layout, geared to Post Panamax III ships of 15 - 18,000 TEUs with 16.5 m draft. Each layout had an initial phase and a fully developed phase. The Maximum Built Out layout has 3.3 km of berthage and 240 ha, with capacity of 5 - 6.6 million TEUs -- sufficient for accommodating the long-term traffic of Central Chile. The plan was approved by the Chilean Government (2017).
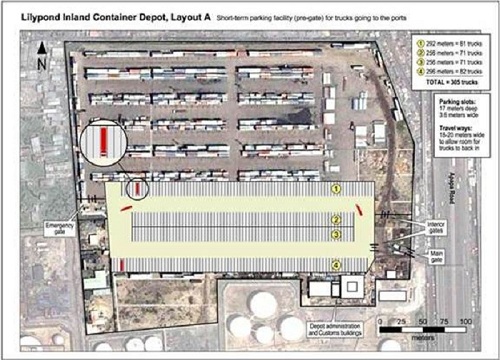
To resolve gate congestion in Lagos, Nigeria, we proposed a concept of Pre-Gate Truck Terminal, electronically linked with the gates of Lagos' 3 marine terminals located 3 - 5 km away. Trucks will be identified by RFID tugs (design by Paul Woodbury). Port Pricing and Feasibility Analysis
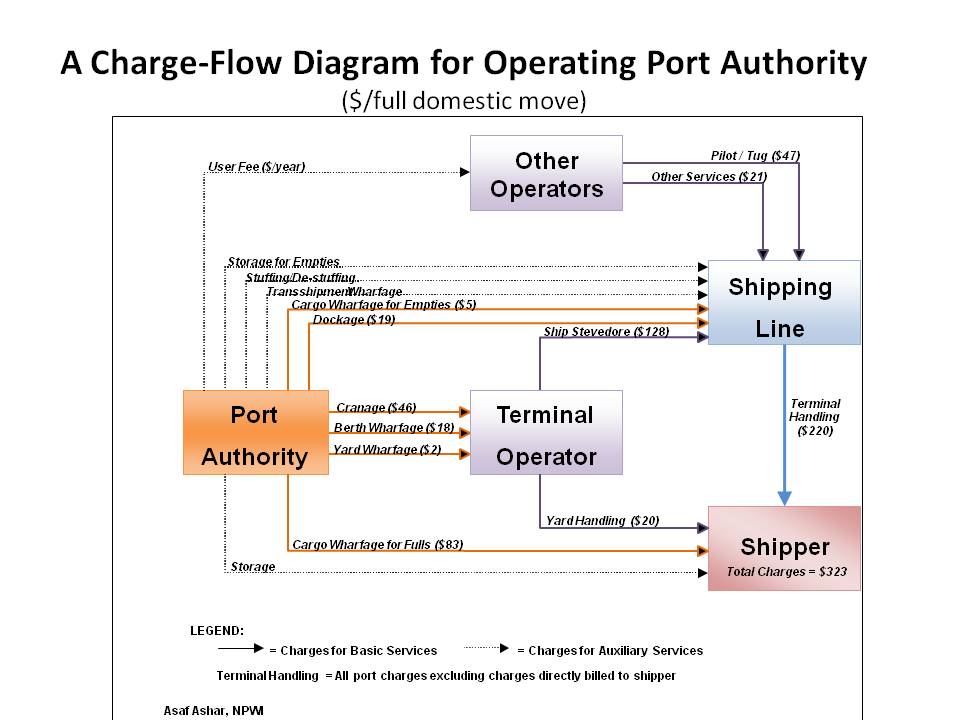
Port cost is a common concern for port authorities, shippers and governments. Charge-Flow diagram is an analytical tool we have developed for examining the total cost (charges) and its various components in a port system consisting of multiple operators and complex intra-operator charges. The tool was employed in many port-cost assessments, including a cost comparison of 20 Latin and North American ports conducted for the Port Society of Cartagena, Columbia.
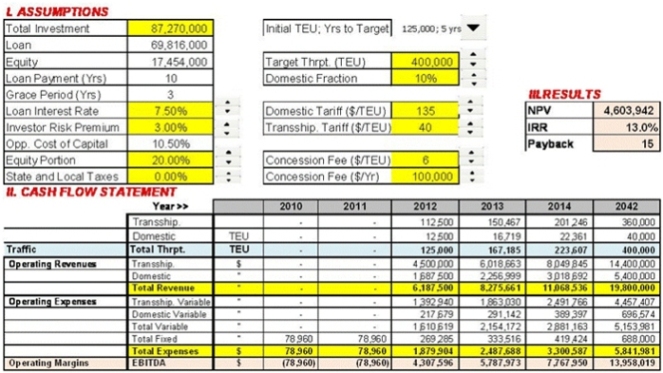
Assessing the feasibility of green-field port, such a new transshipment hub in Haiti, requires the examination of many variables and specifying complex scenarios and conditions. Our financial model includes a series of draw-down menus and macro-driven buttons for controlling each of the main variables, allowing instant sensitivity testing. The summary worksheet of this model is presented above. Dr. Asaf Ashar |